

We heard feedback loud and clear on a few things: the dashboard needed to be more useful at a glance, filtering options flow took too many clicks, and the chat could be a lot more helpful when you’re in the middle of scanning.
Over the past few weeks we’ve shipped a set of updates that address exactly that. Nothing flashy for the sake of it — just practical improvements that should make your daily workflow smoother.
Improved Dashboard
The dashboard has been rebuilt with three clear sections:
ETF Bullish and Bearish Flow — see net directional premium across ETFs at the top level.
Money Flow Gauge — a quick visual summary of overall bullish vs bearish pressure.
Stocks Bullish and Bearish Flow — the same clear view for individual names.
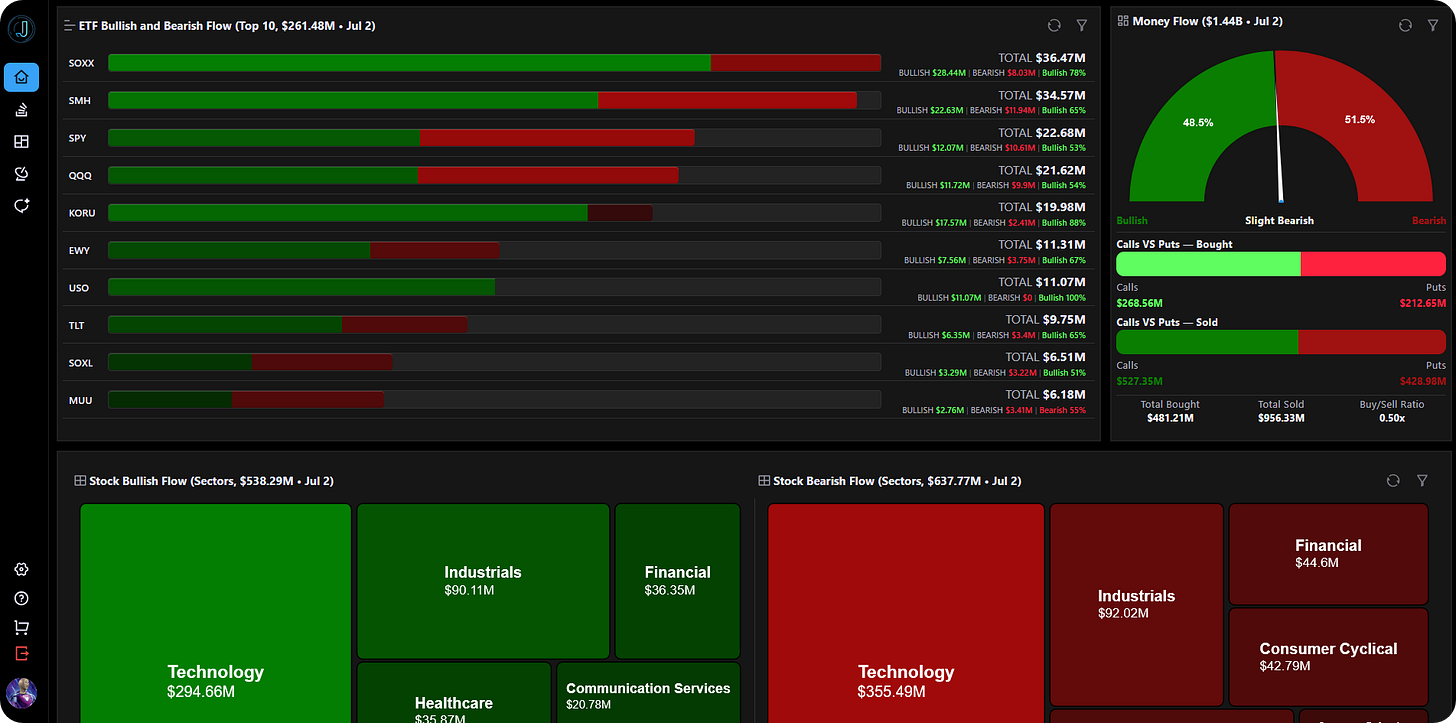
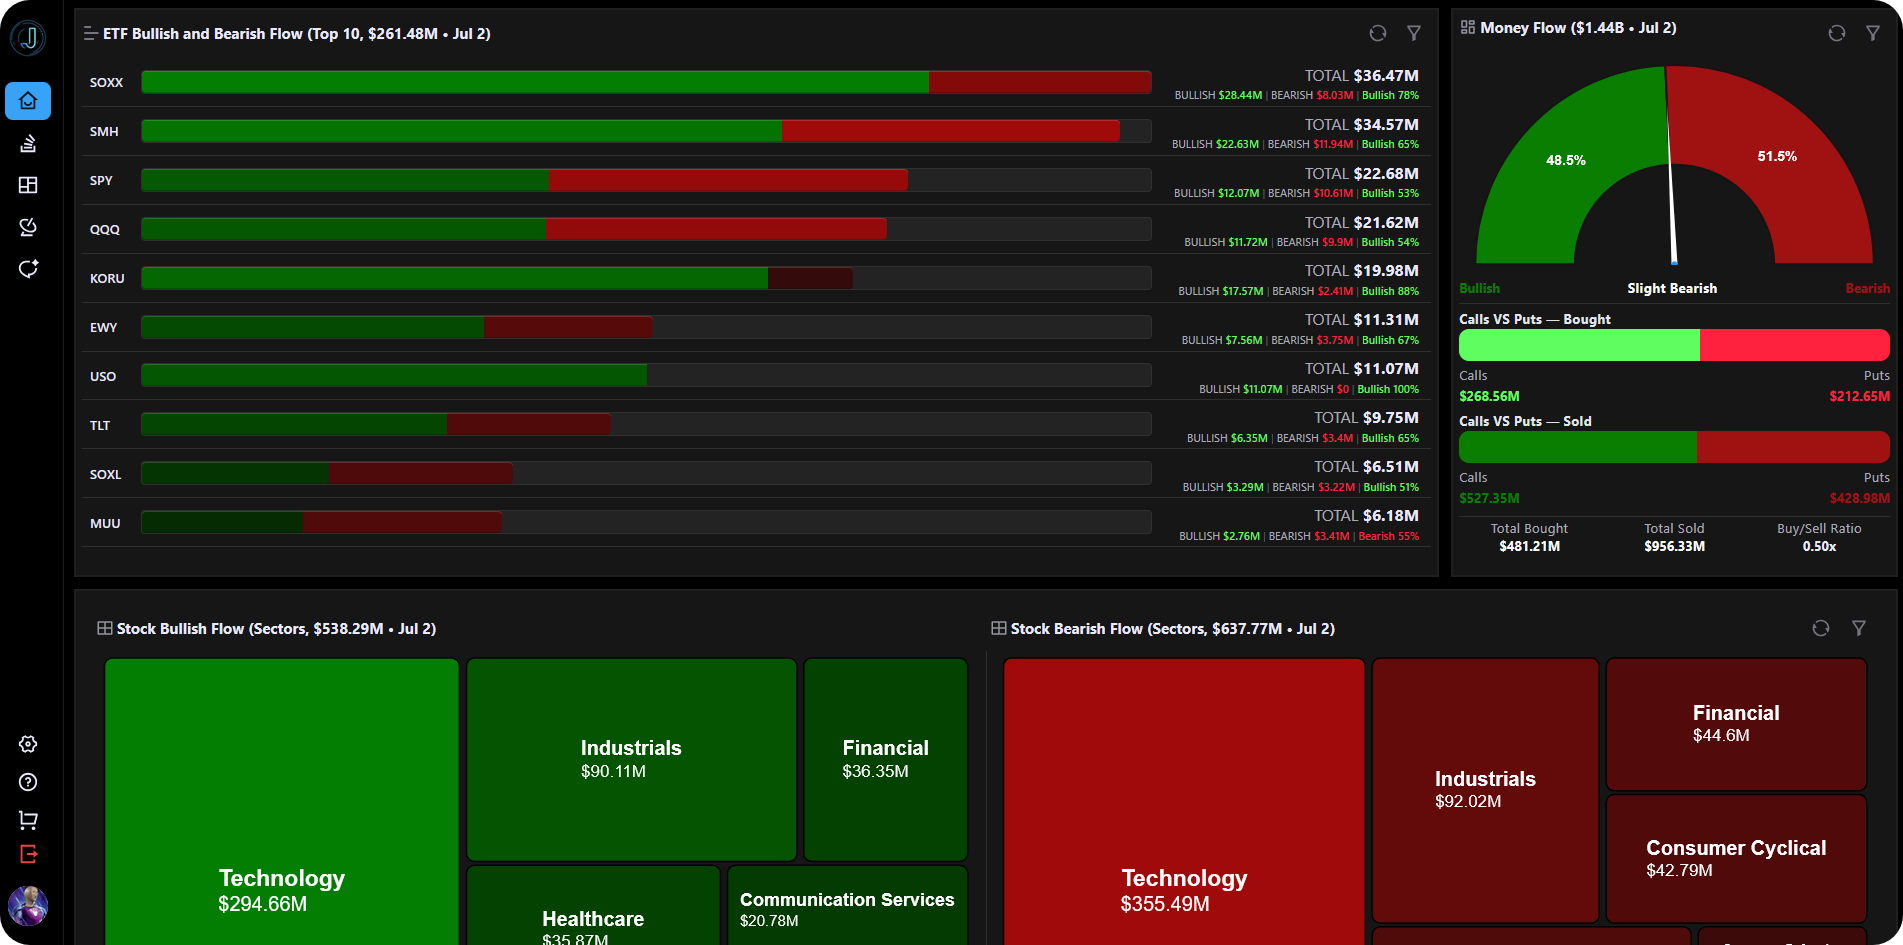
Everything loads faster and the layout is cleaner across desktop and mobile.
Better Filters on the Flow Page
We’ve added the ability to search and filter by industry and sector directly. You can now bookmark specific flow views so you don’t have to rebuild your setup every time.
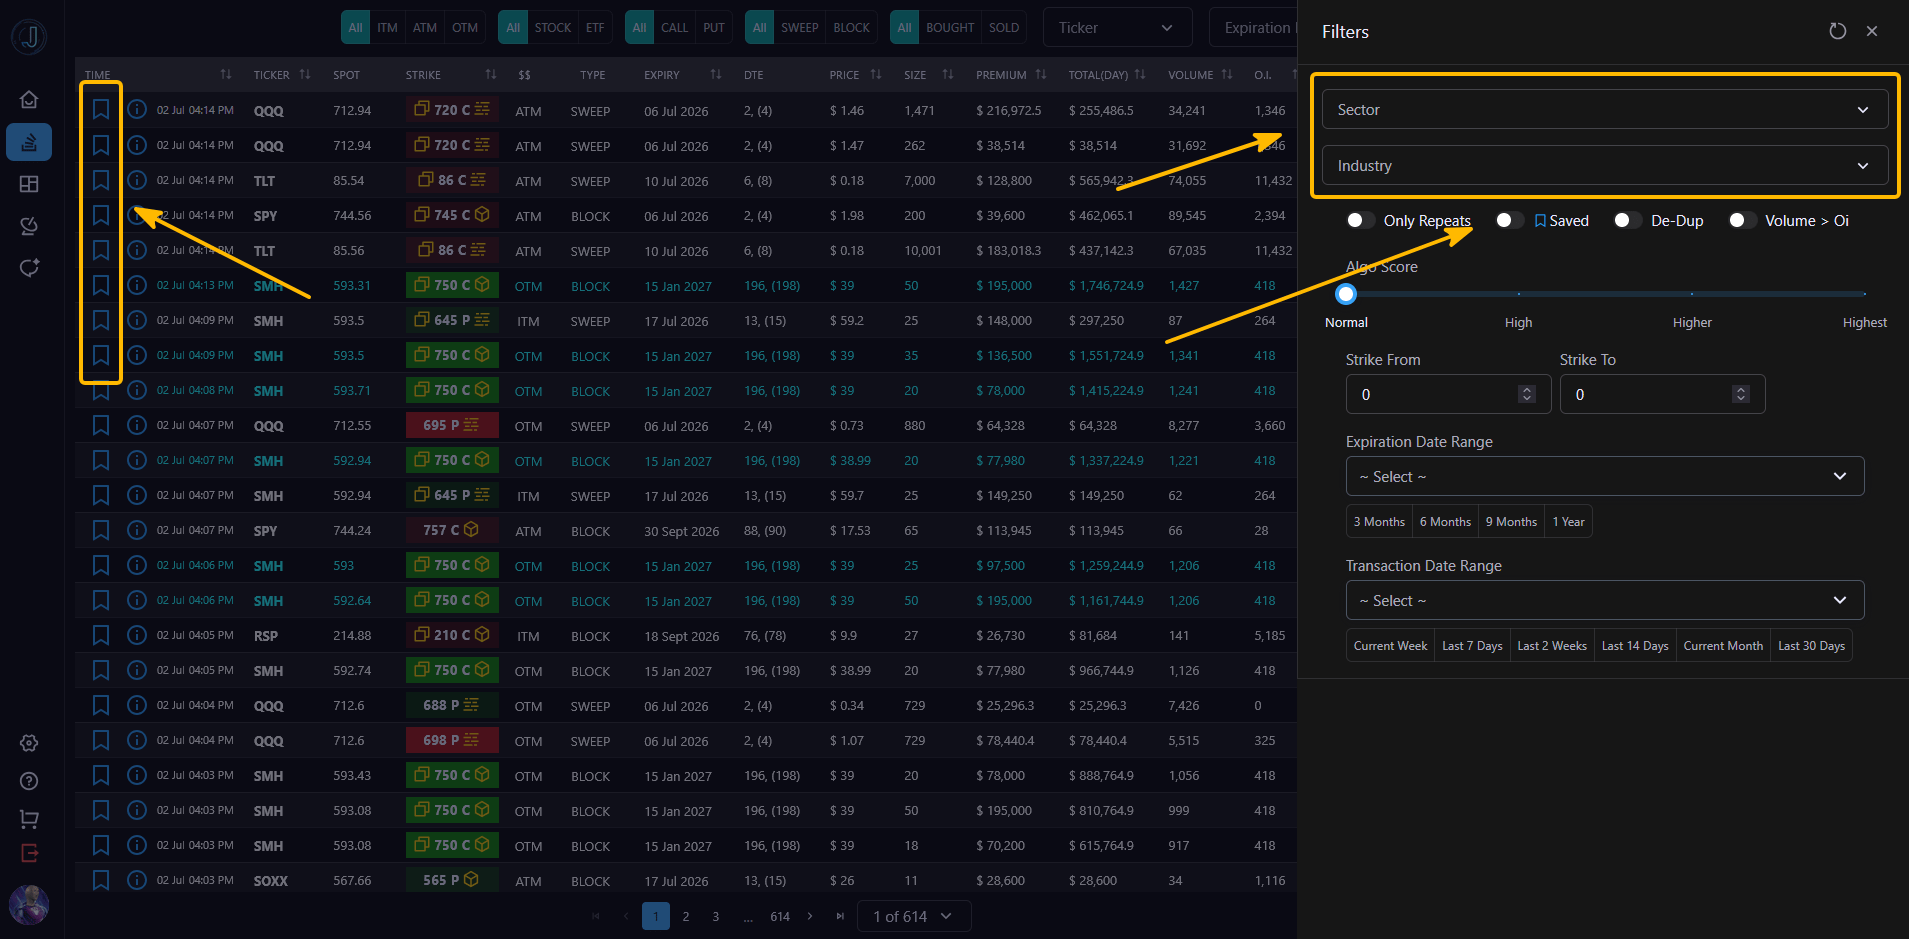
The entire filtering experience has a significantly better UI on both desktop and mobile, so it’s faster to narrow down exactly what you’re looking for.
New Heatmap Page with Drilldowns
This is one of the bigger additions. The new Heatmap page gives you a visual overview of where bullish and bearish premium is concentrated across industries and sectors.
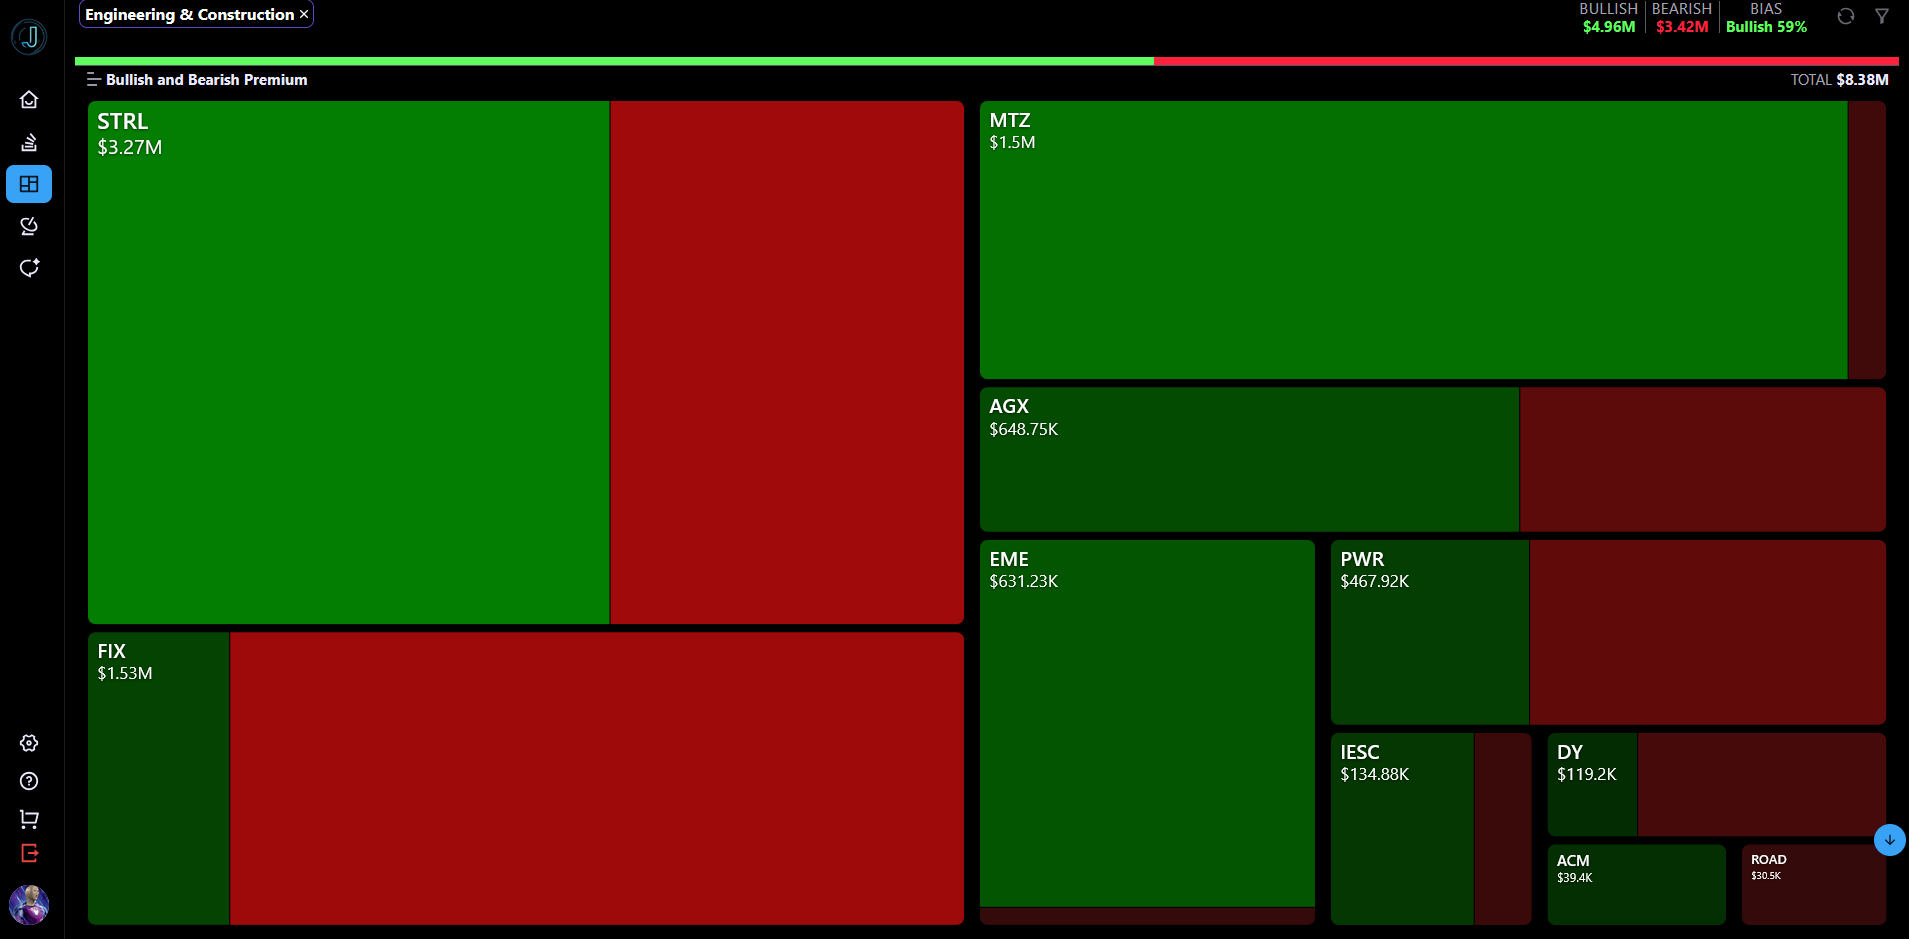
Industry-level heatmap with overall bullish/bearish totals and bias at the top.
Green and red blocks are sized by dollar amount, so you can instantly see which areas are seeing the most activity. Click any block to drill down into the individual stocks or names driving that flow. You can also switch between heatmap and list view, filter by moneyness, trade type, algo score, and date ranges.
Major Improvements to Jarvis Chat (Beta)
Jarvis Chat has received a big upgrade in both response quality and interface. It’s now much better at understanding context from your current scans and can generate charts directly in the conversation.
You can ask things like:
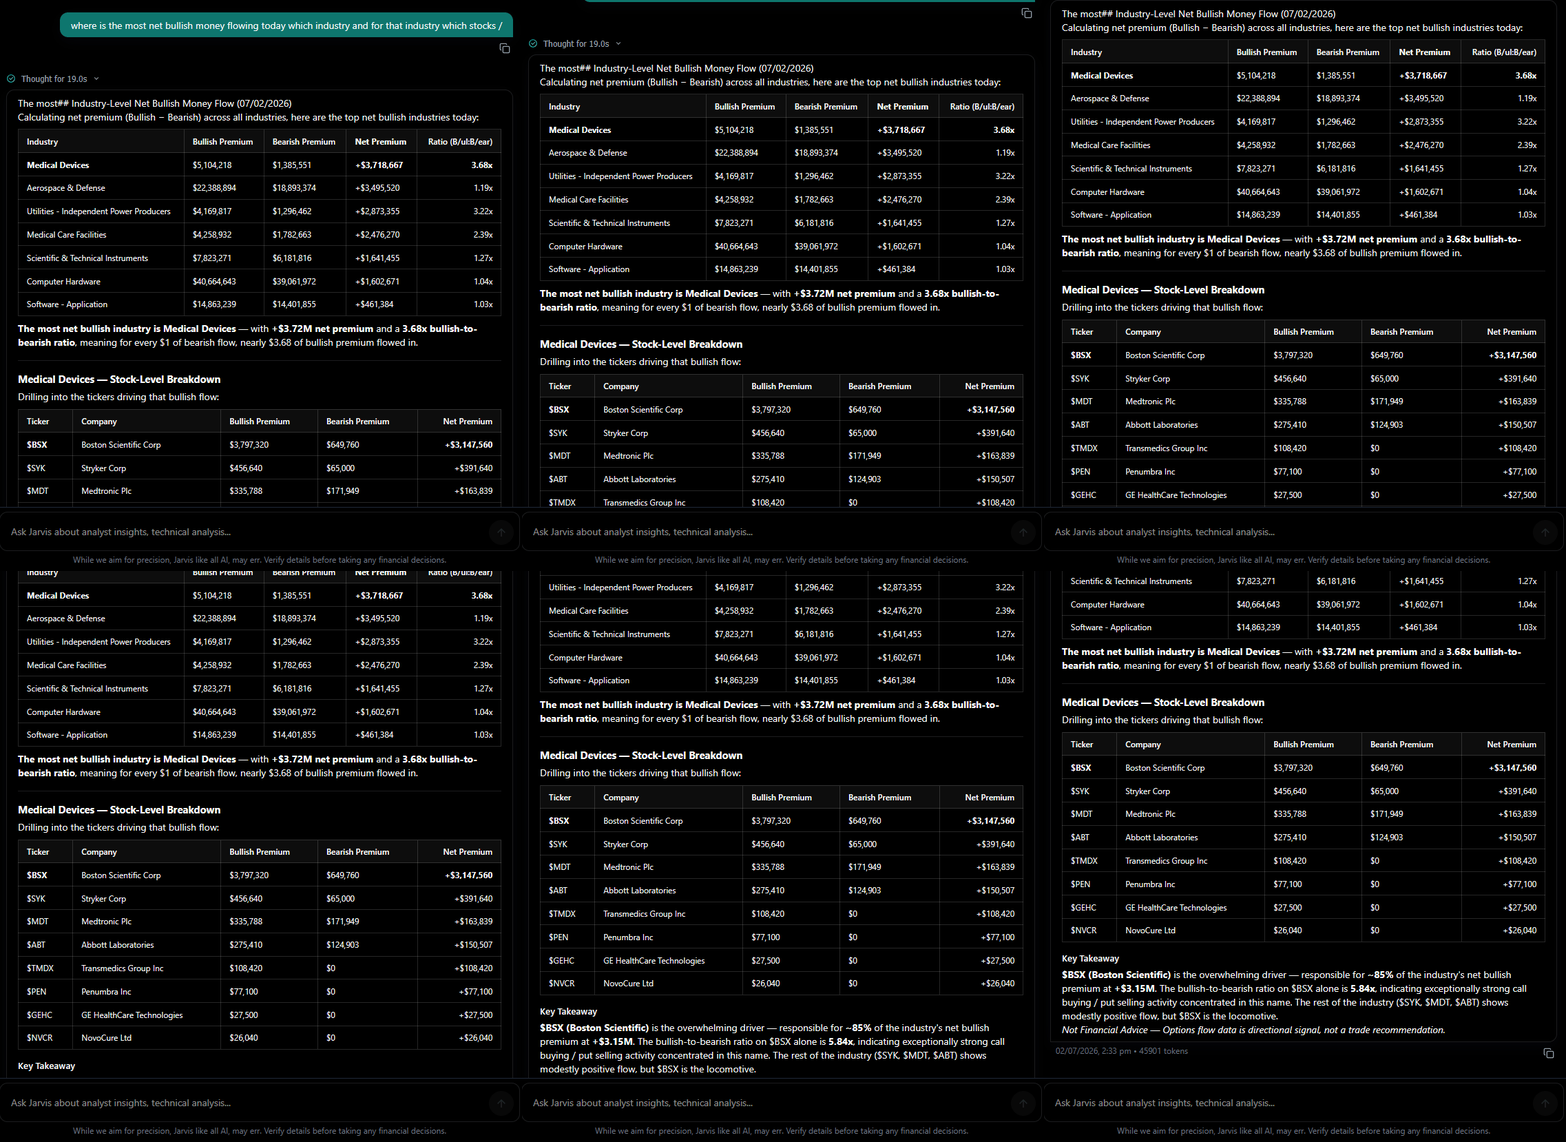
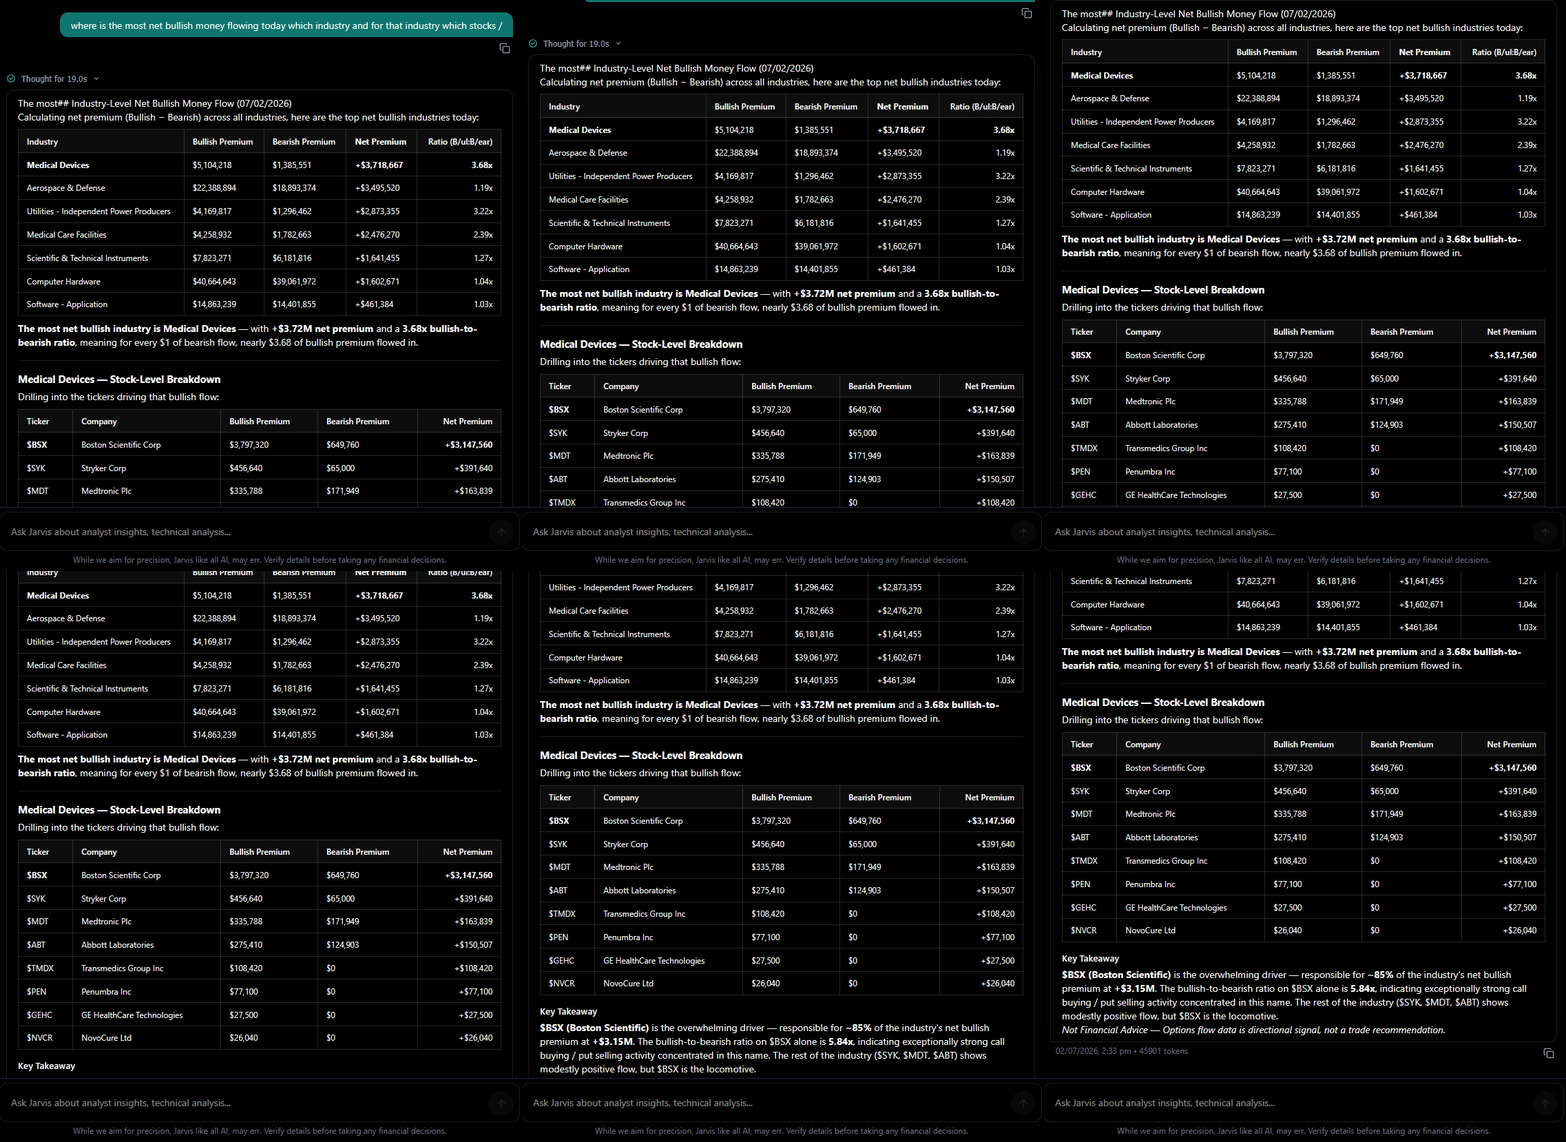
“Where is the most net bullish money flowing today, and which stocks in that industry are driving it?”
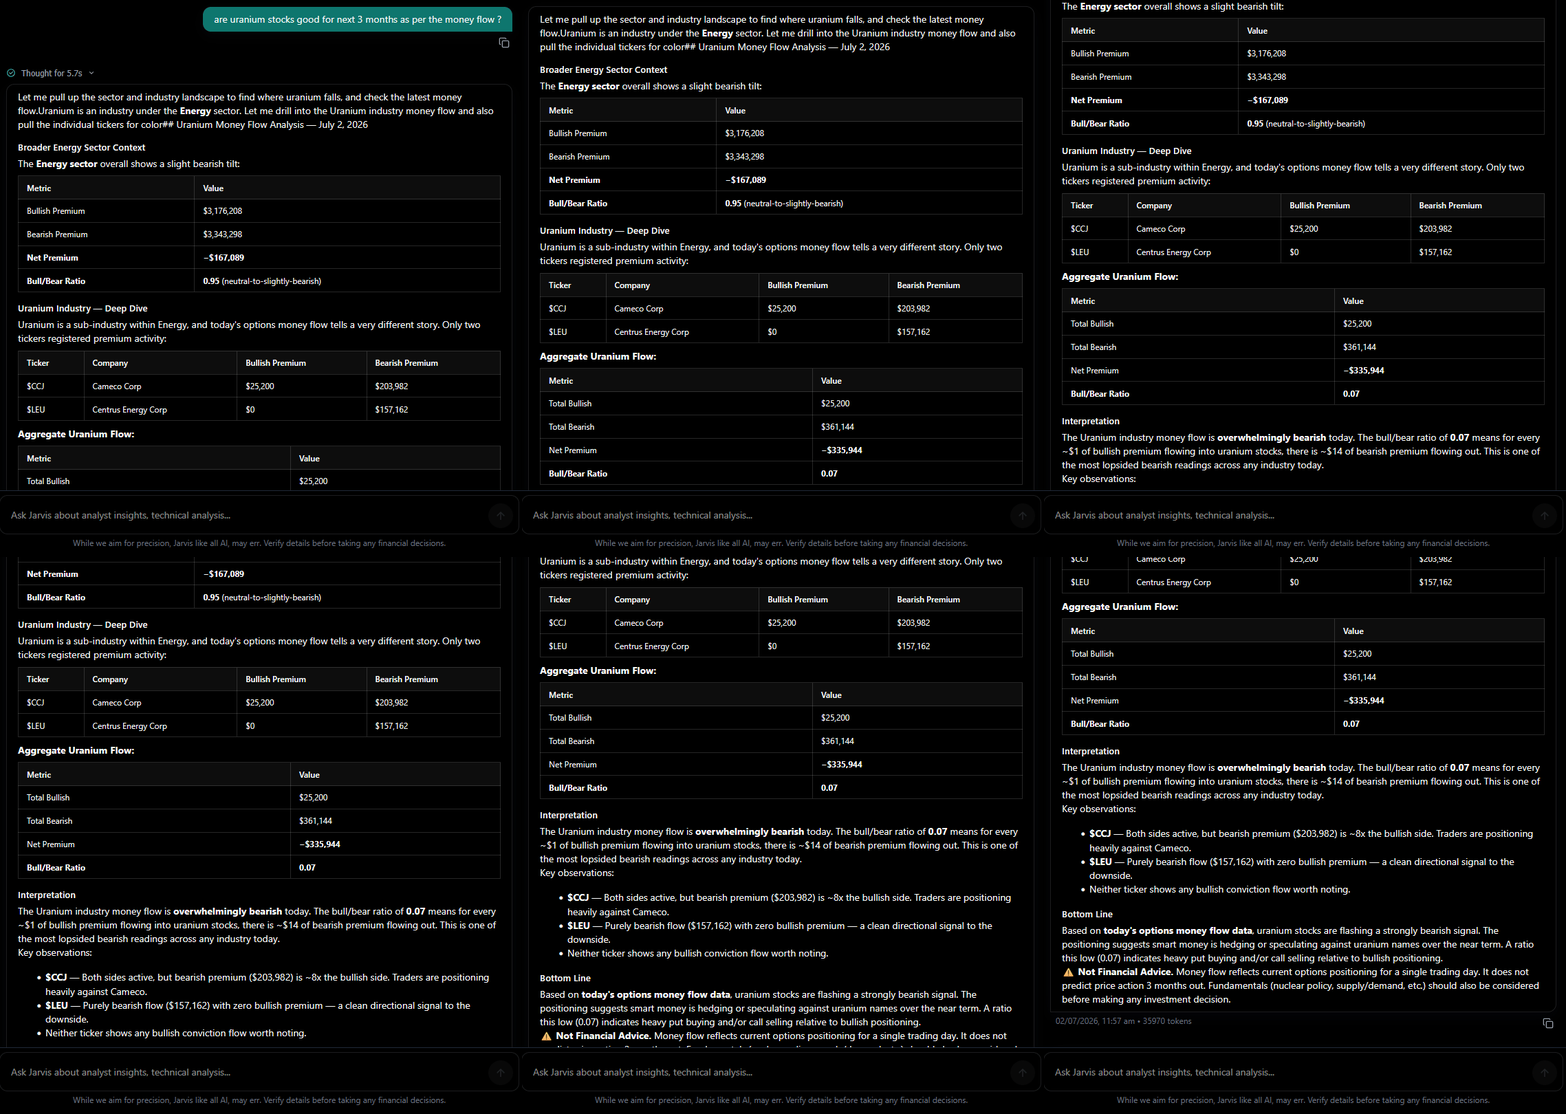
“Are uranium stocks showing strength over the next 3 months based on money flow?”
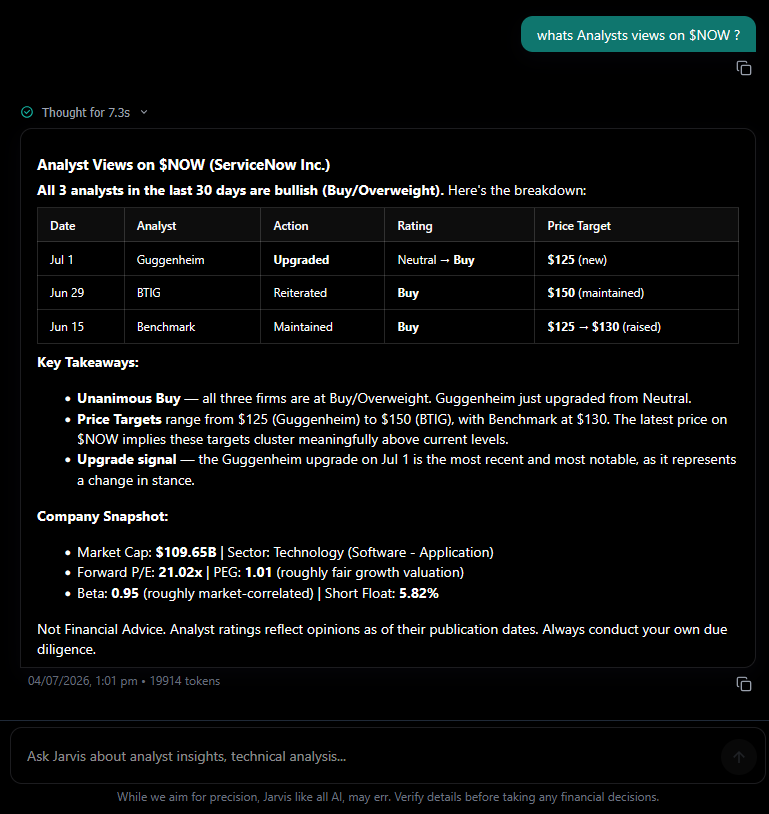
“What are analysts saying about $NOW right now?”
“Give me the top 10 industries with more bullish than bearish flow by size.”
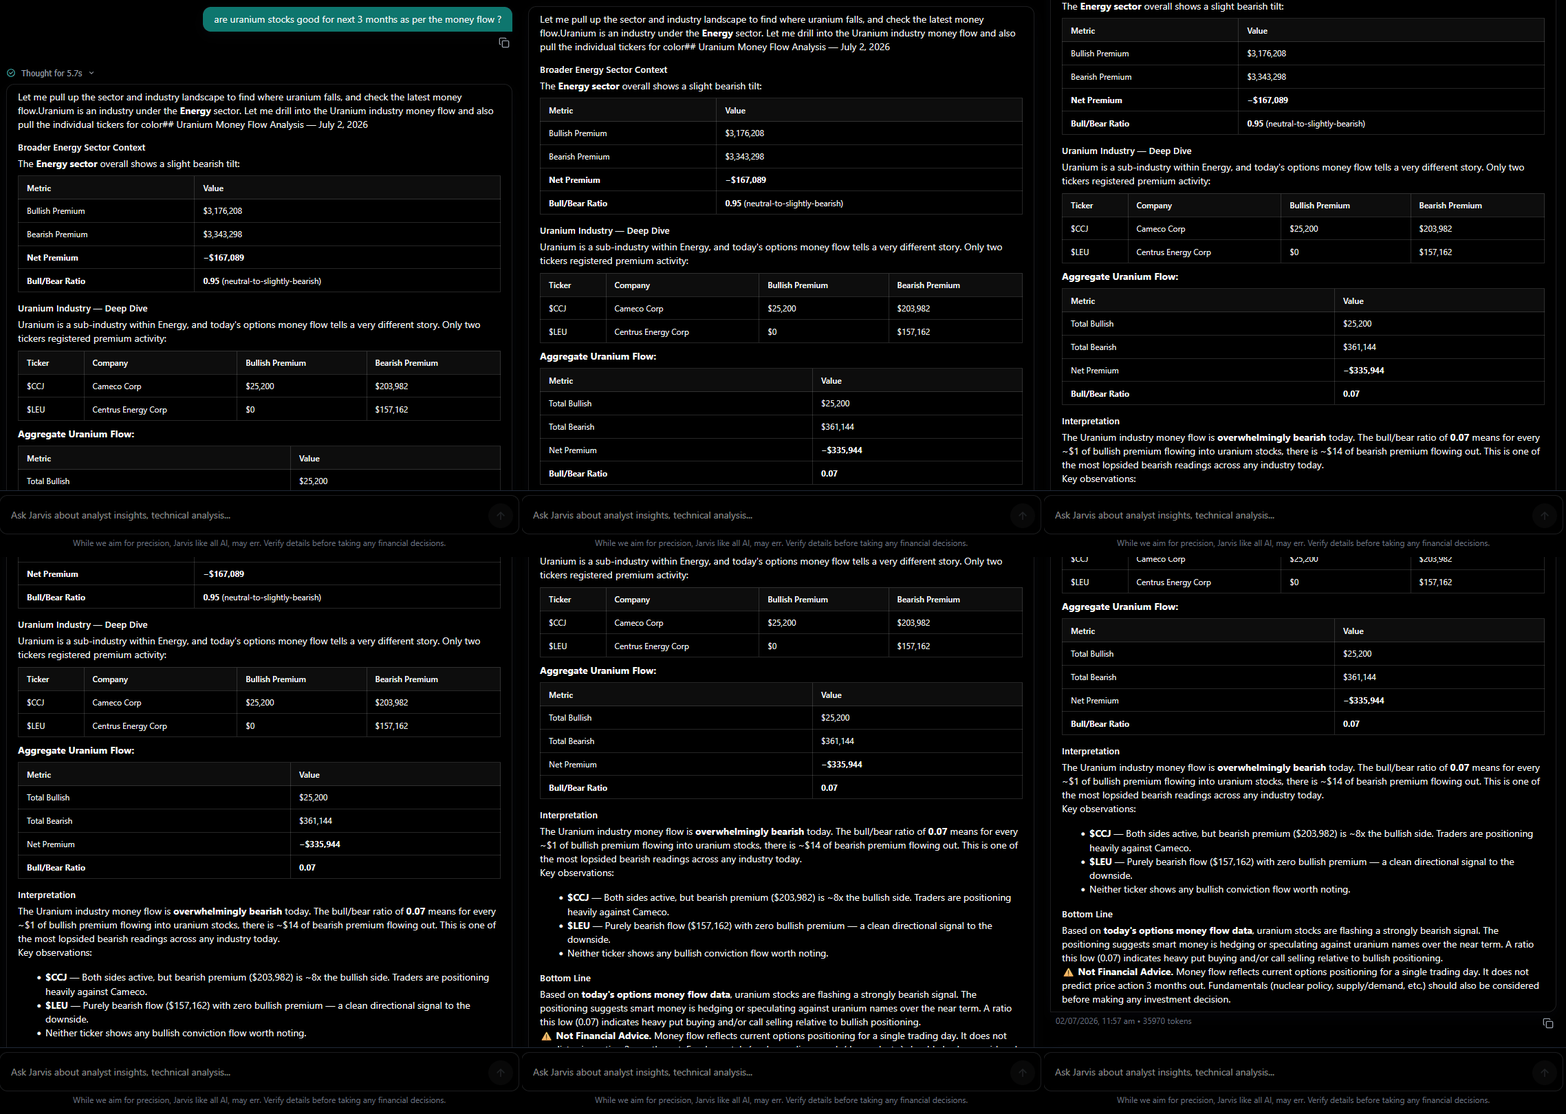
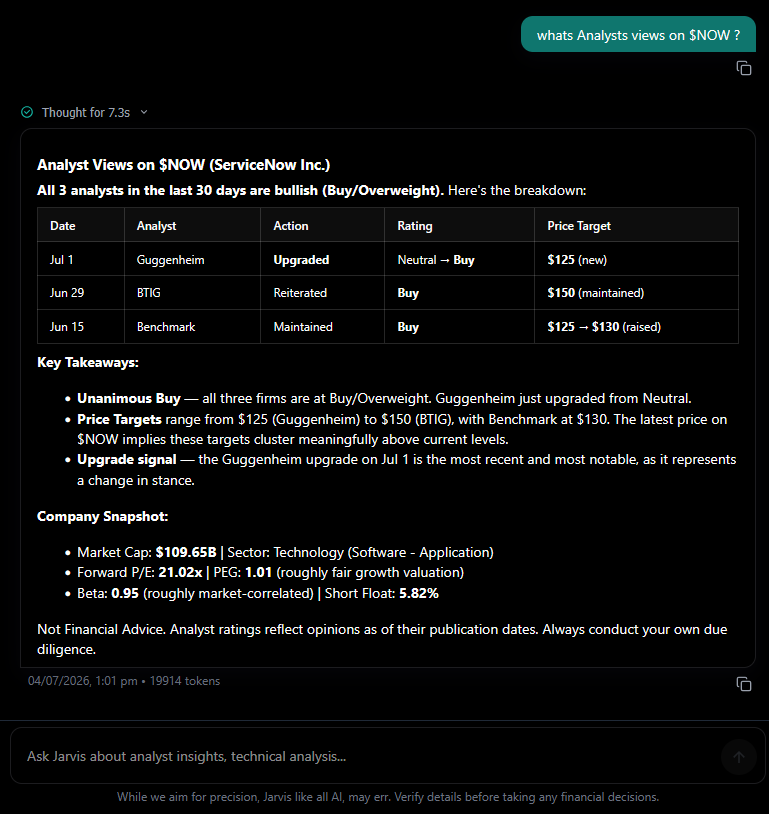
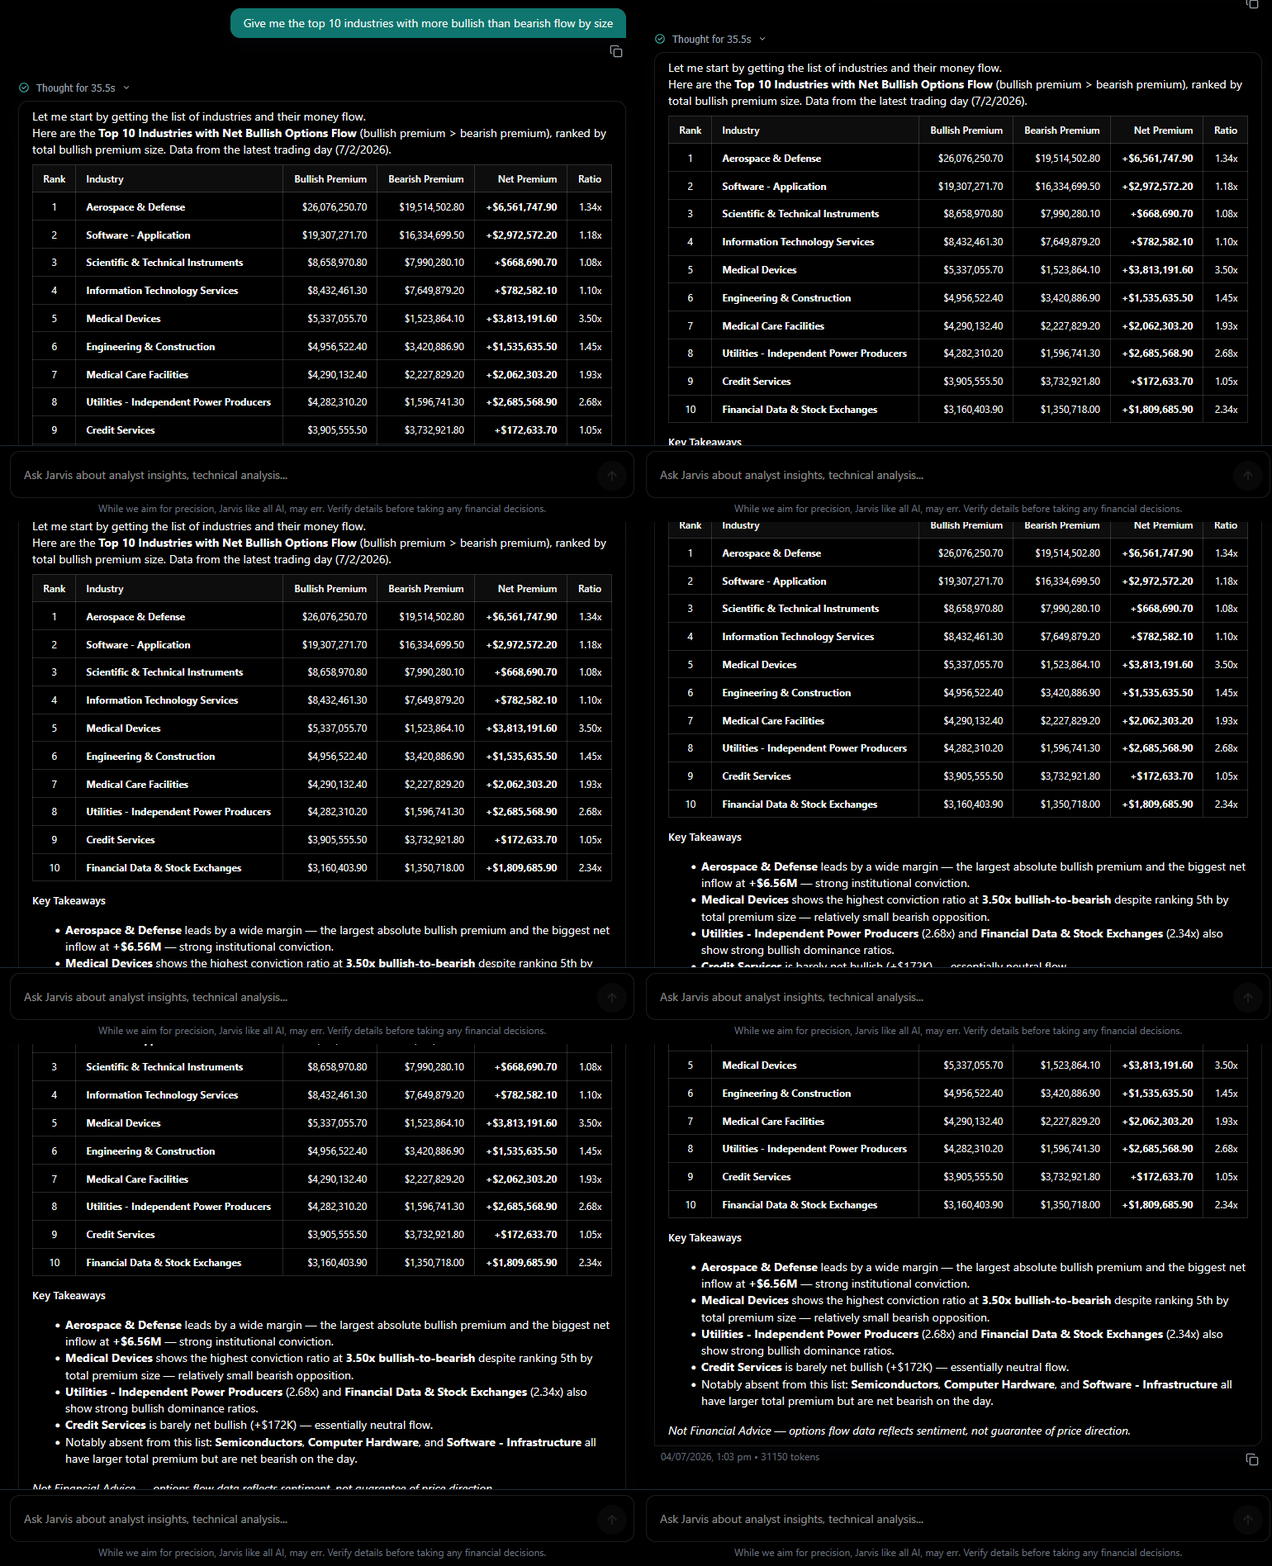
The goal is to let you stay in one place and get both data and visual context without jumping between tabs.
Why These Updates Matter
These changes came directly from how people are actually using JarvisFlow day to day. Faster filtering, better visual overviews, and a chat that can actually help interpret what the flow is showing should make it easier to focus on the trades that matter.
We’re not trying to overwhelm you with features, just making the core experience stronger.
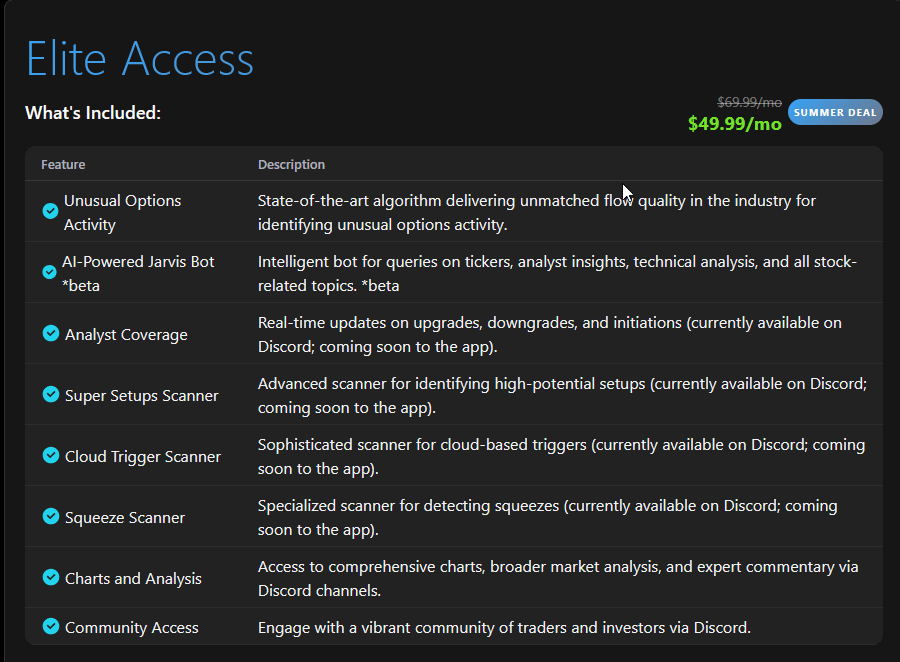
Summer Deal – 30% Off 6 Months
If you’ve been considering JarvisFlow or want to extend your access, we’re running a summer promotion through July 31.
Use code 4july to get 30% off 6 months when subscribing via Whop:
https://whop.com/c/jarvisflow/substack
Or subscribe directly in the app with PayPal at $49.99/month:
https://app.jarvisflow.io/purchase
We’d love to hear what you think of the new features. Drop a comment below or reply to this email — your feedback continues to shape what we build next.
:)
-Tony Stonk